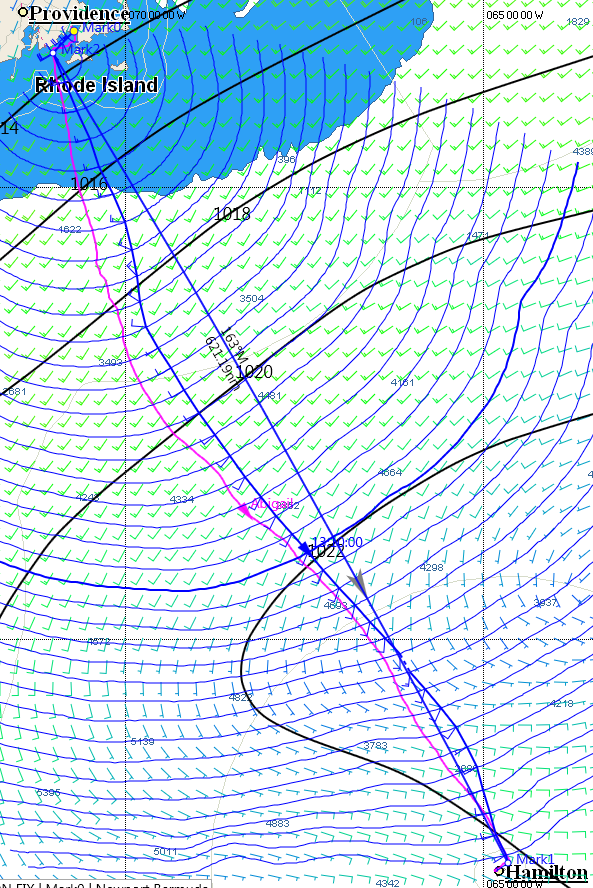
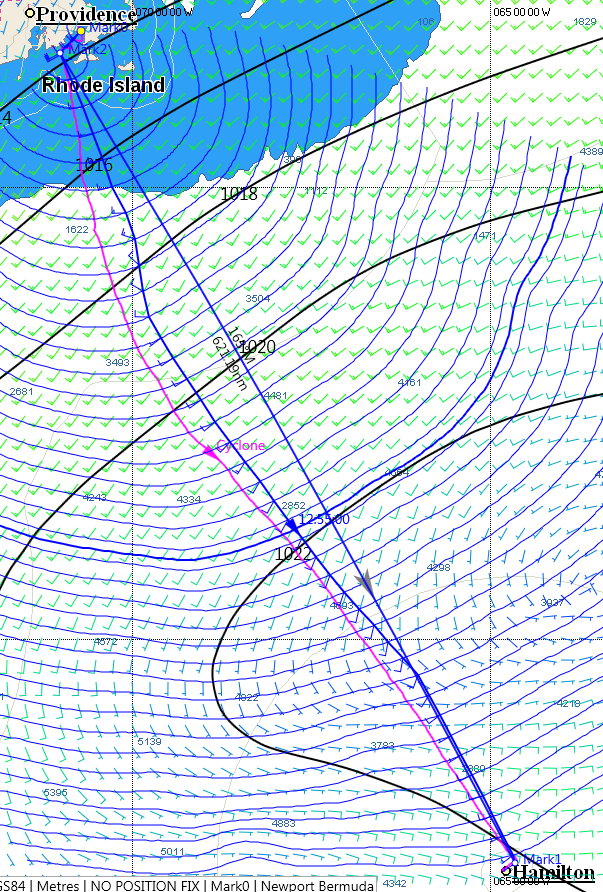
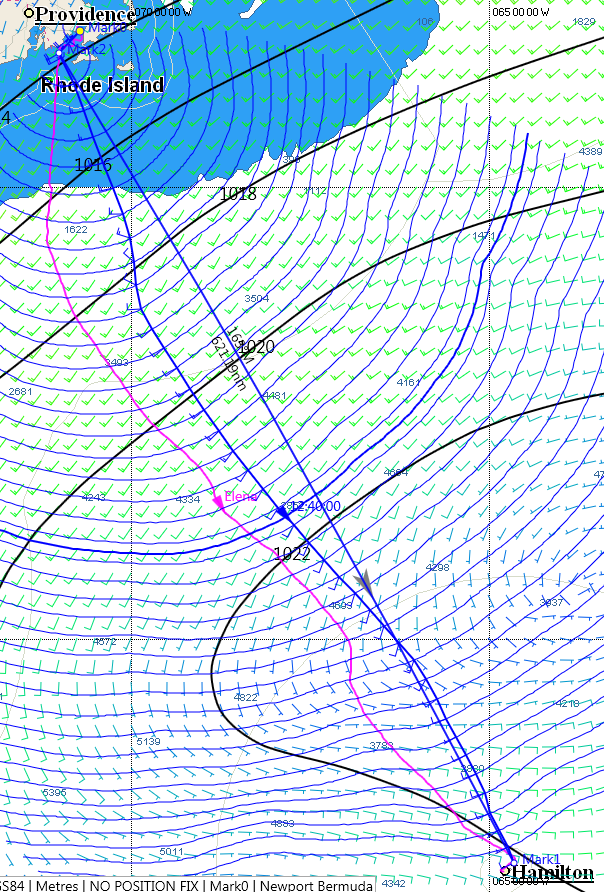
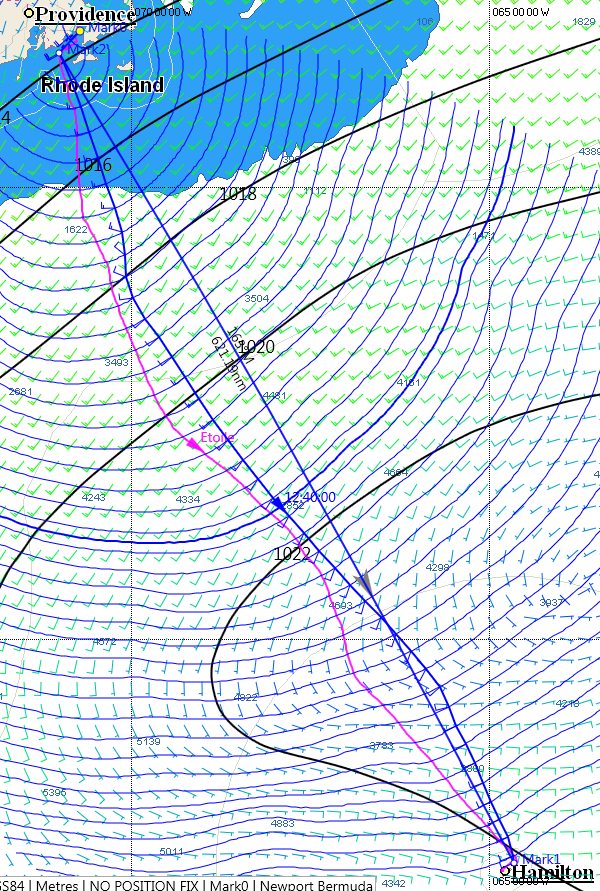
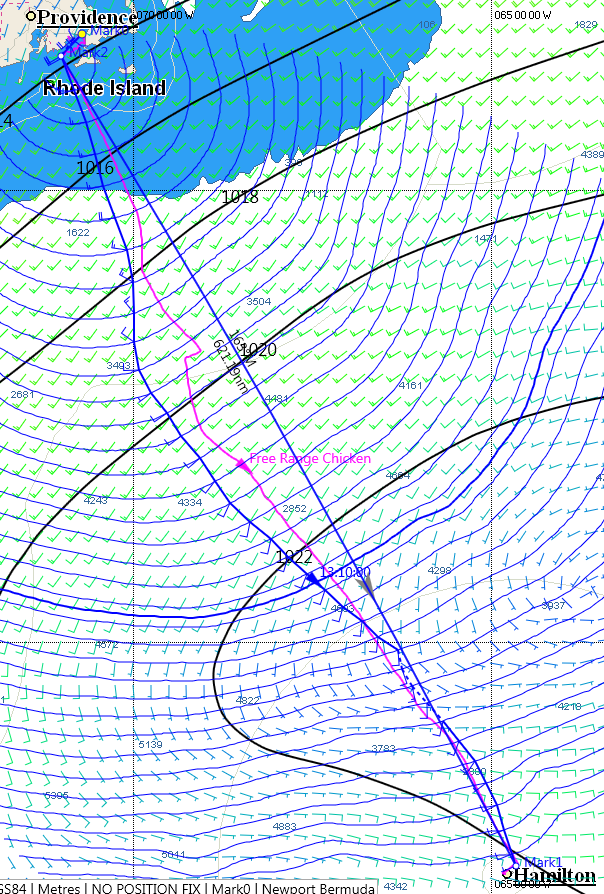
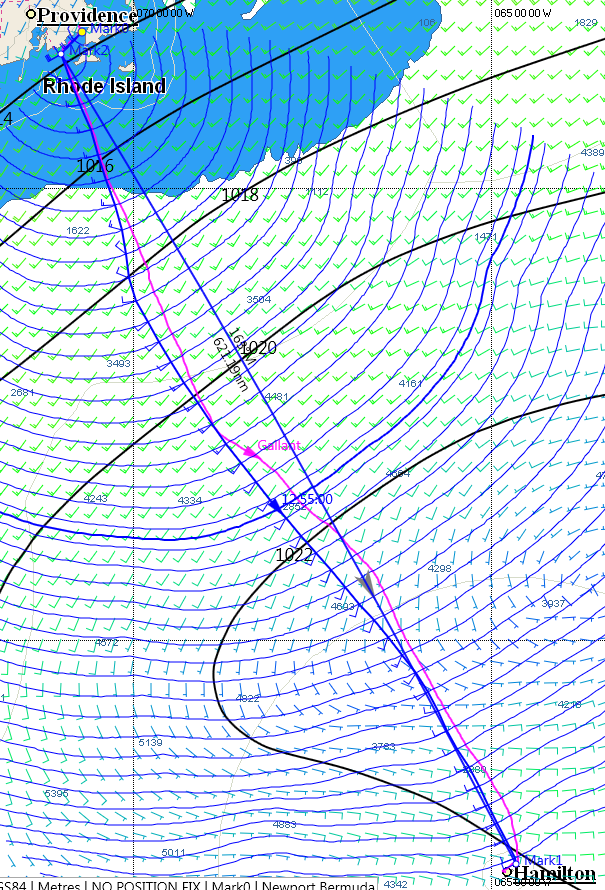
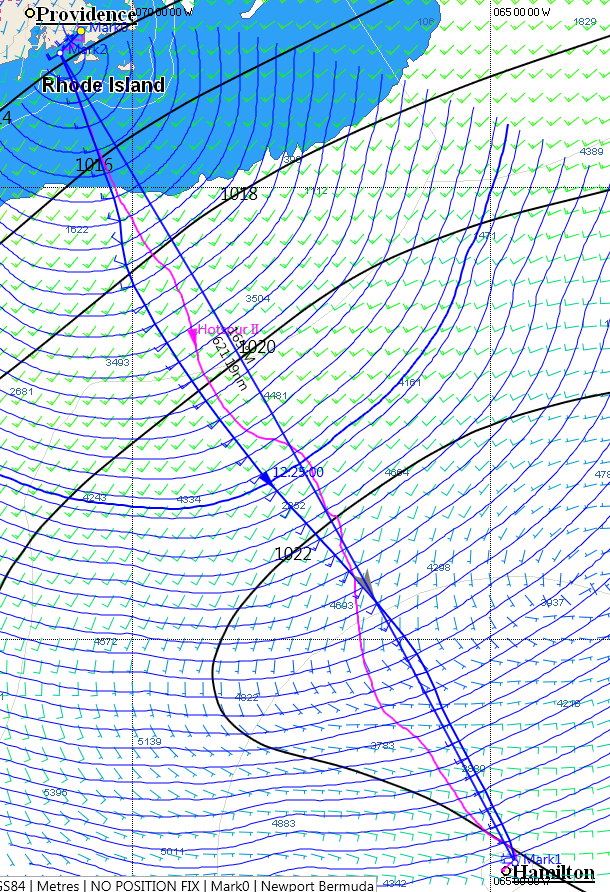
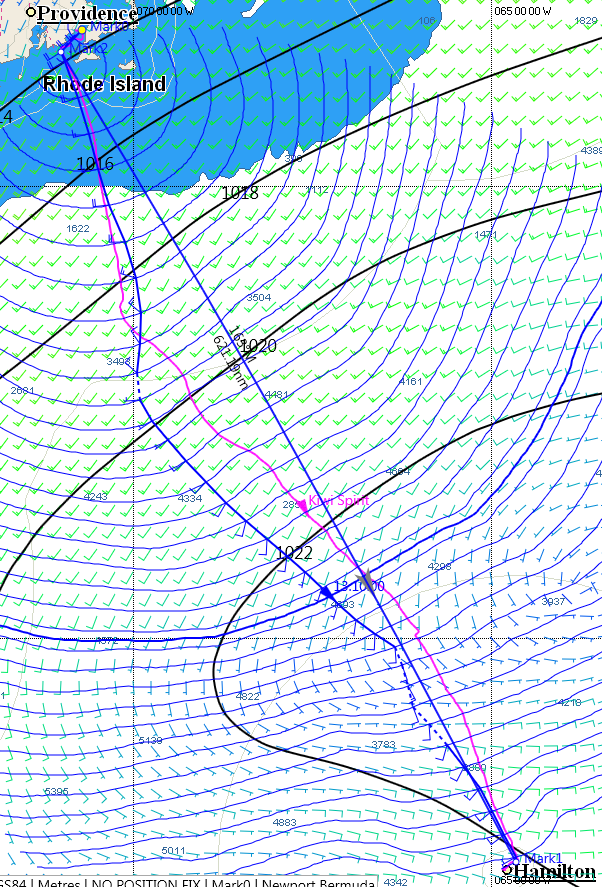
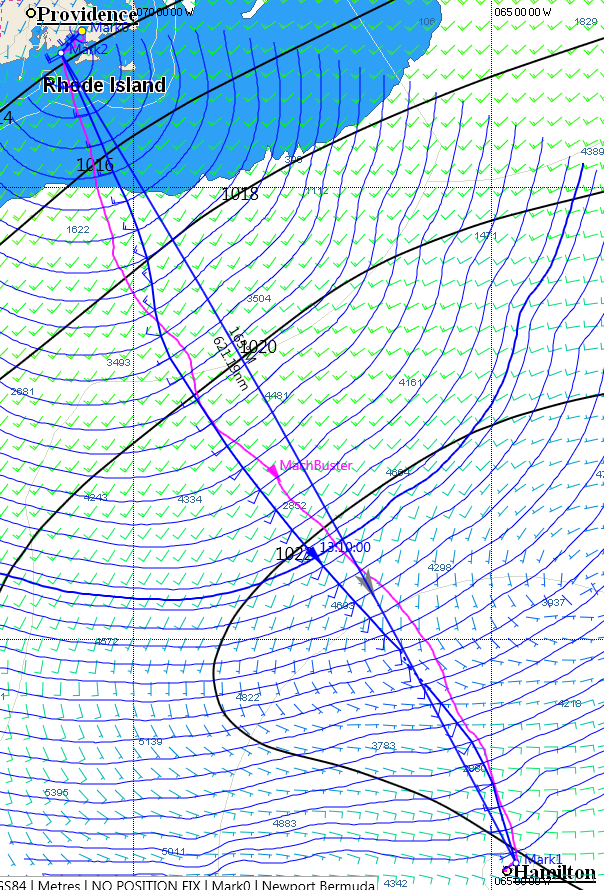
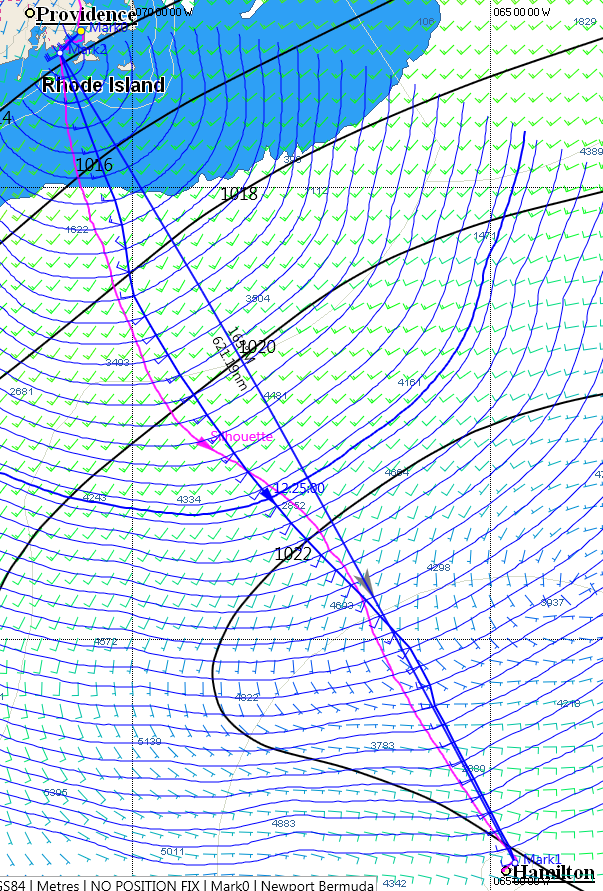
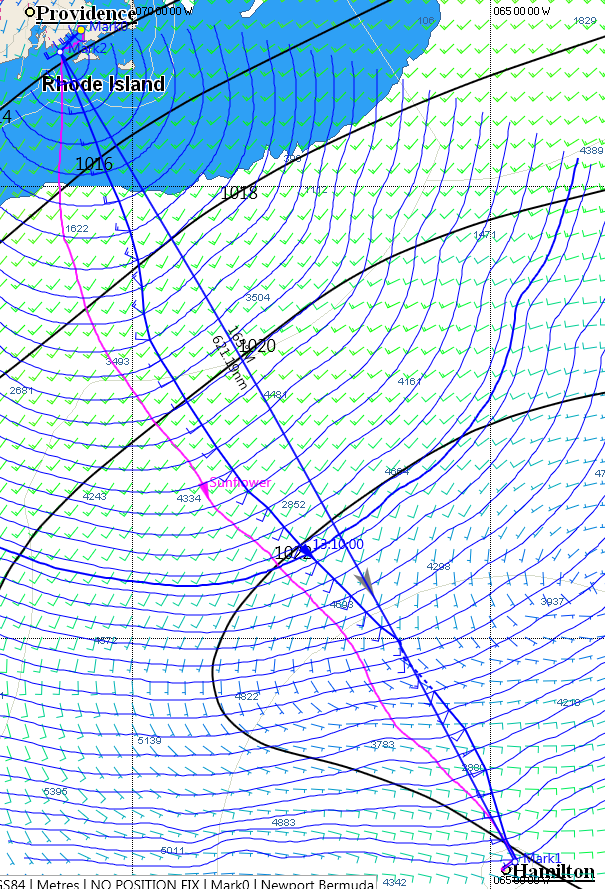
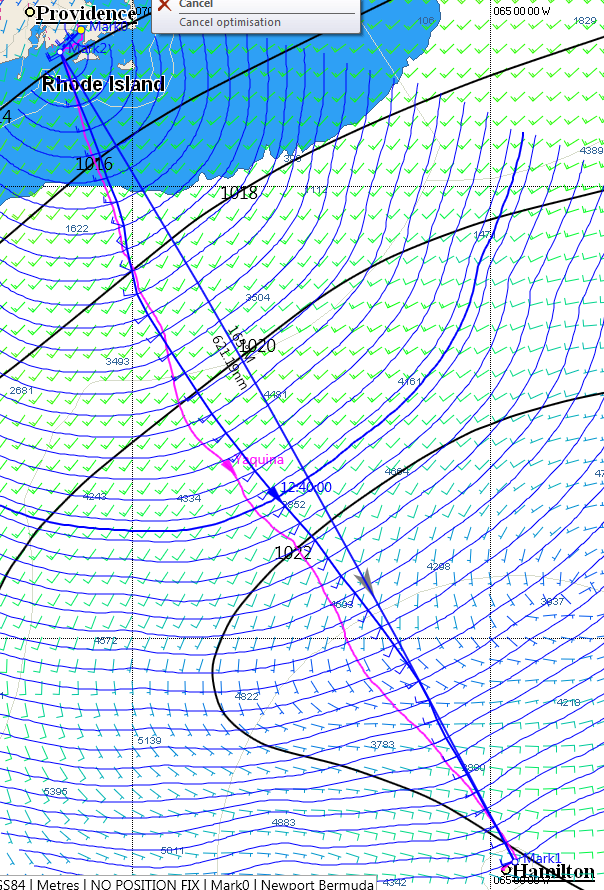
2019 H0 Grib Plot Analysis with Yellow Brick Track
Grib Plot Key

Rhumb Line
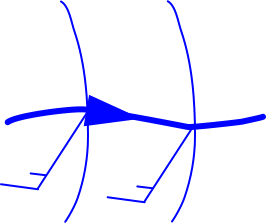
Expedition routing software (version 10.10.18) recommended course with 2-hour isochrones (each isochrones displays where the boat could be after a fixed number of hours of sailing) and wind flags (short line is 5 knots, long line is 10 knots) at that point. Triangle is at 0900 Sunday.

Actual Track (Yellow Brick). Triangle is at 0900 Sunday.
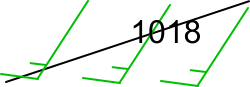
Wind flags (short line is 5 knots, long line is 10 knots) and air pressure at 0900 Sunday.
Grib Discussion
Brief - The attached analysis shows side by side comparisons of the tracks through the water for all the competitors in the 2019 Marion to Bermuda race. Select the yacht in the left column to show her plot. Each image illustrates, for one boat, two tracks:
- The magenta line shows the positions as recorded by Yellowbrick.
- The blue line shows the calculated track using Expedition routing software, version 10.10.18.
The images are saved from the Expedition display. A few comments on that display:
- Expedition displays a chart that is adjusted to show the race course from the start of Marion, MA to the finish off St. David's light in Bermuda.
- The Marion to Bermuda race has two legs, the start to Sow & Pigs Reef, and from there to the finish.
- There is a rhumb line in blue that shows the shortest great circle route for each leg.
- The display of wind is shown across the entire chart as a series of wind flags that indicate direction and velocity. The wind is represented in a GRIB file, produced by NOAA, that has records throughout the course of the race. Those records can be displayed at any time, using one hour increments.
- The wind field displayed for all the boats in this analysis is for 0900 Sunday EDT. Yellowbrick displays the position of the boat on its track at that time with an arrow.
- The calculated track from Expedition is the optimal routing track, indicating the fastest way to sail the course. Optimal routing uses the course layout and wind (GRIB files) and boat speed polars, in this case from the Offshore Racing Rule (ORR) used also to score the race.
- The blue curves that cover most of the chart are isochrones. Each isochrones displays where the boat could be after a fixed number of hours of sailing. Therefore, the distance between the isochrones indicates how fast the boat is sailing. (Isochrones that are close together show reduced boat speed.) These isochrones are separated by two hours.
- Along the blue optimal track there are wind vectors at the intersection of each isochrones that indicate the wind that occurred at that point in the race.
H0 GRIB file - The wind file being used for optimal routing is a string of "Hour Zero" models of the wind as created by NOAA using observations. These are NOT forecasts. Each Hour Zero record is concatenated with subsequent records throughout the race. Because H0 does not use forecasts the file used for optimal routing of a boat is not available until after the boat finishes.
ABIGAIL
ARDENT
ATHENA
AUGUST WEST
CONCERT
CORDELIA
CYCLONE
DAUNTLESS
DEFIANCE
ELENA
ESCAPADE II
ETOILE
FREE RANGE CHICKEN
FROLIC
GALLANT
HONU
HOTSPUR II
KINSHIP
KIWI SPIRIT
MACHBUSTER
MAX
MERIDIAN
MISS RED
MOJO
MOMENTUM
PINNACLE
PIPER
POUCHY
RESTIVE
SCAPPARE
SCARLET
SELKIE
SILHOUETTE
SUNFLOWER
TABOR BOY
TIARA
YAQUINA
YUMI III
 Name: ABIGAIL
Elapsed: 87.1669 hours
Expedition Predicted: 77.6131 hours
Efficiency: 89.0%
ORR Predicted: 83.5042 hours
Class: A
ORR Rating: 0.972
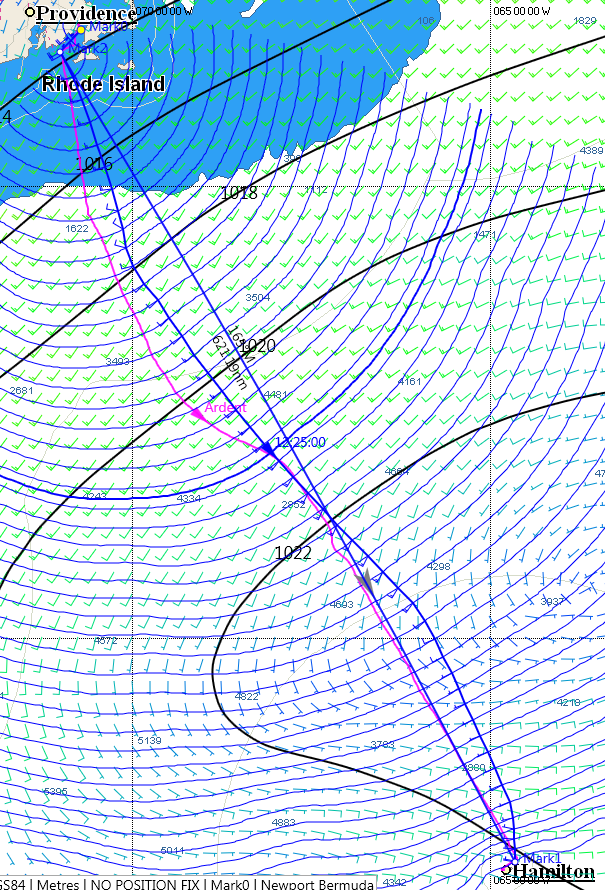 Name: ARDENT
Elapsed: 107.2647 hours
Expedition Predicted: 97.6497 hours
Efficiency: 91.0%
ORR Predicted: 104.7304 hours
Class: D
ORR Rating: 0.775
 Name: ATHENA
Elapsed: 96.05 hours
Expedition Predicted: 79.0569 hours
Efficiency: 82.3%
ORR Predicted: 86.3469 hours
Class: B
ORR Rating: 0.94
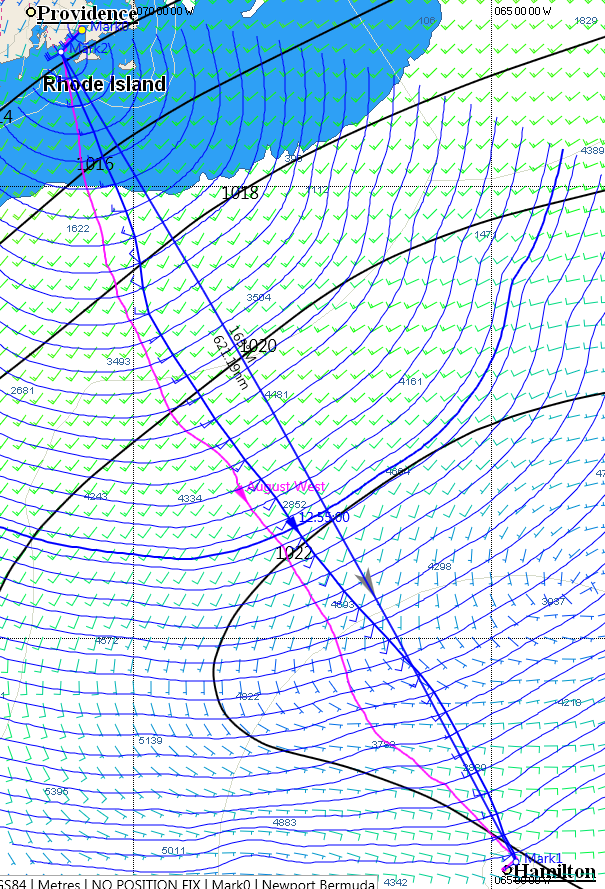 Name: AUGUST WEST
Elapsed: 94.3189 hours
Expedition Predicted: 79.9811 hours
Efficiency: 84.8%
ORR Predicted: 86.4389 hours
Class: B
ORR Rating: 0.939
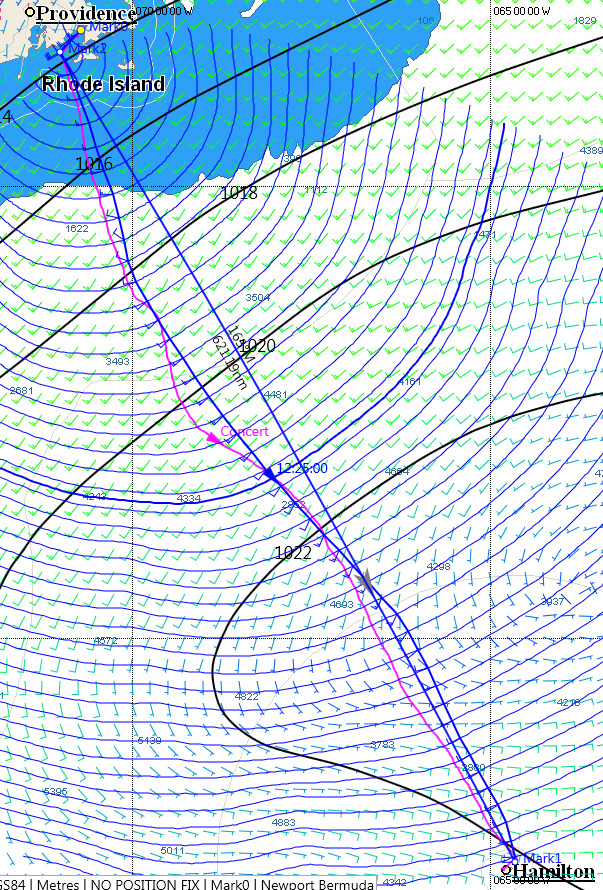 Name: CONCERT
Elapsed: 98.3047 hours
Expedition Predicted: 90.2631 hours
Efficiency: 91.8%
ORR Predicted: 99.9582 hours
Class: D
ORR Rating: 0.812
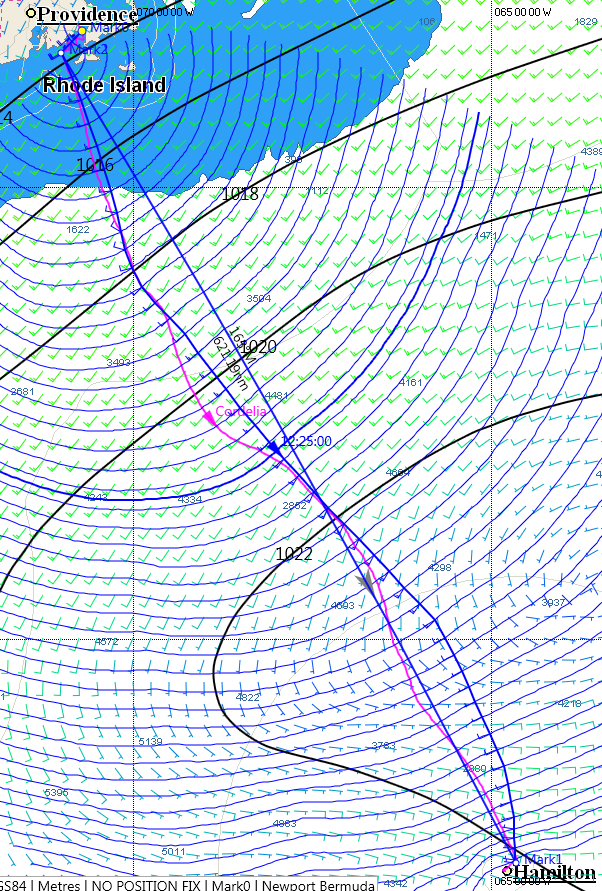 Name: CORDELIA
Elapsed: 101.8392 hours
Expedition Predicted: 98.1947 hours
Efficiency: 96.4%
ORR Predicted: 107.7903 hours
Class: D
ORR Rating: 0.753
 Name: CYCLONE
Elapsed: 95.225 hours
Expedition Predicted: 79.9197 hours
Efficiency: 83.9%
ORR Predicted: 85.89 hours
Class: B
ORR Rating: 0.945
 Name: DAUNTLESS
Elapsed: 96.3994 hours
Expedition Predicted: 84.2964 hours
Efficiency: 87.4%
ORR Predicted: 93.7253 hours
Class: C
ORR Rating: 0.866
 Name: DEFIANCE
Elapsed: 92.3758 hours
Expedition Predicted: 83.5206 hours
Efficiency: 90.4%
ORR Predicted: 92.4443 hours
Class: B
ORR Rating: 0.878
 Name: ELENA
Elapsed: 98.5853 hours
Expedition Predicted: 83.0431 hours
Efficiency: 84.2%
ORR Predicted: 93.5093 hours
Class: C
ORR Rating: 0.868
 Name: ESCAPADE II
Elapsed: 96.9933 hours
Expedition Predicted: 85.7444 hours
Efficiency: 88.4%
ORR Predicted: 97.7905 hours
Class: C
ORR Rating: 0.83
 Name: ETOILE
Elapsed: 106.78 hours
Expedition Predicted: 84.0203 hours
Efficiency: 78.7%
ORR Predicted: 96.7415 hours
Class: C
ORR Rating: 0.839
 Name: FREE RANGE CHICKEN
Elapsed: 92.7889 hours
Expedition Predicted: 73.8103 hours
Efficiency: 79.5%
ORR Predicted: 76.8618 hours
Class: A
ORR Rating: 1.056
 Name: FROLIC
Elapsed: 99.6444 hours
Expedition Predicted: 87.7597 hours
Efficiency: 88.1%
ORR Predicted: 101.2046 hours
Class: D
ORR Rating: 0.802
 Name: GALLANT
Elapsed: 90.9661 hours
Expedition Predicted: 83.6464 hours
Efficiency: 92.0%
ORR Predicted: 92.5497 hours
Class: B
ORR Rating: 0.877
 Name: HONU
Elapsed: 109.3903 hours
Expedition Predicted: 88.0039 hours
Efficiency: 80.4%
ORR Predicted: 98.983 hours
Class: D
ORR Rating: 0.82
 Name: HOTSPUR II
Elapsed: 117.7969 hours
Expedition Predicted: 90.5522 hours
Efficiency: 76.9%
ORR Predicted: 101.9674 hours
Class: D
ORR Rating: 0.796
 Name: KINSHIP
Elapsed: 86.8506 hours
Expedition Predicted: 77.4647 hours
Efficiency: 89.2%
ORR Predicted: 83.936 hours
Class: A
ORR Rating: 0.967
 Name: KIWI SPIRIT
Elapsed: 84.2997 hours
Expedition Predicted: 71.2442 hours
Efficiency: 84.5%
ORR Predicted: 69.2543 hours
Class: A
ORR Rating: 1.172
 Name: MACHBUSTER
Elapsed: 87.0025 hours
Expedition Predicted: 75.8022 hours
Efficiency: 87.1%
ORR Predicted: 80.682 hours
Class: A
ORR Rating: 1.006
 Name: MAX
Elapsed: 94.0622 hours
Expedition Predicted: 78.7775 hours
Efficiency: 83.8%
ORR Predicted: 85.0798 hours
Class: A
ORR Rating: 0.954
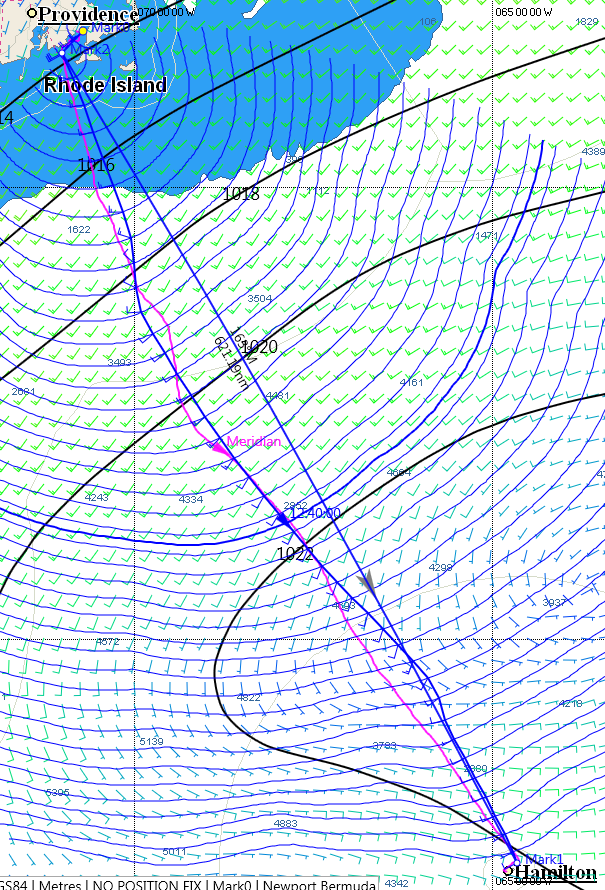 Name: MERIDIAN
Elapsed: 96.4822 hours
Expedition Predicted: 82.4964 hours
Efficiency: 85.5%
ORR Predicted: 95.0423 hours
Class: C
ORR Rating: 0.854
 Name: MISS RED
Elapsed: 105.1958 hours
Expedition Predicted: 85.6897 hours
Efficiency: 81.5%
ORR Predicted: 95.602 hours
Class: C
ORR Rating: 0.849
 Name: MOJO
Elapsed: 94.2394 hours
Expedition Predicted: 79.4147 hours
Efficiency: 84.3%
ORR Predicted: 86.531 hours
Class: B
ORR Rating: 0.938
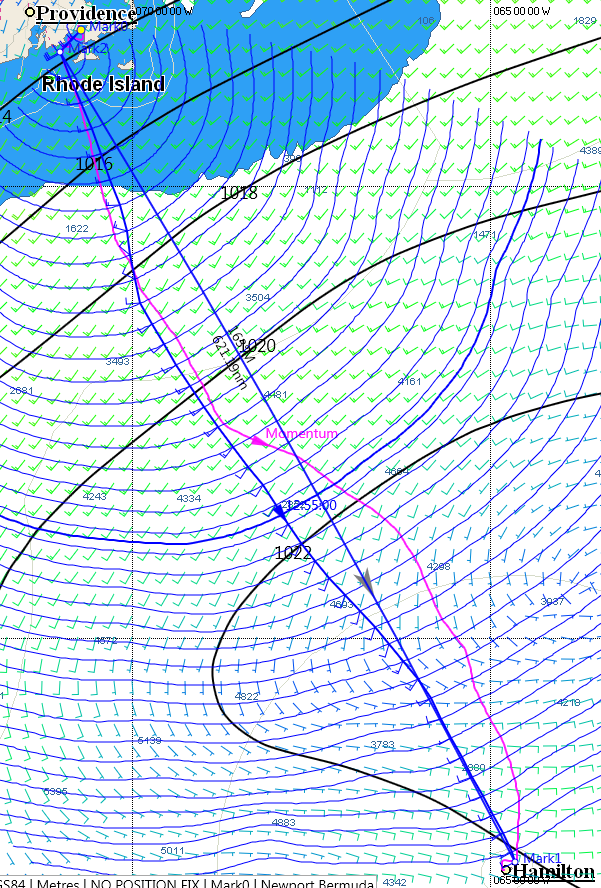 Name: MOMENTUM
Elapsed: 90.5958 hours
Expedition Predicted: 82.1314 hours
Efficiency: 90.7%
ORR Predicted: 90.7898 hours
Class: B
ORR Rating: 0.894
 Name: PINNACLE
Elapsed: 95.8025 hours
Expedition Predicted: 83.8467 hours
Efficiency: 87.5%
ORR Predicted: 95.7147 hours
Class: C
ORR Rating: 0.848
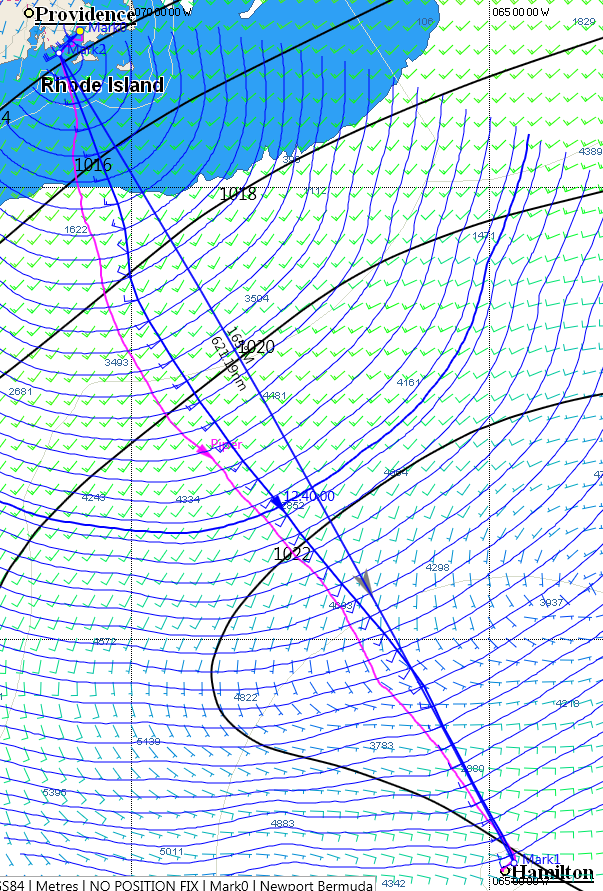 Name: PIPER
Elapsed: 98.8492 hours
Expedition Predicted: 84.1089 hours
Efficiency: 85.1%
ORR Predicted: 94.0511 hours
Class: C
ORR Rating: 0.863
 Name: POUCHY
Elapsed: 100.6175 hours
Expedition Predicted: 88.9603 hours
Efficiency: 88.4%
ORR Predicted: 99.4682 hours
Class: D
ORR Rating: 0.816
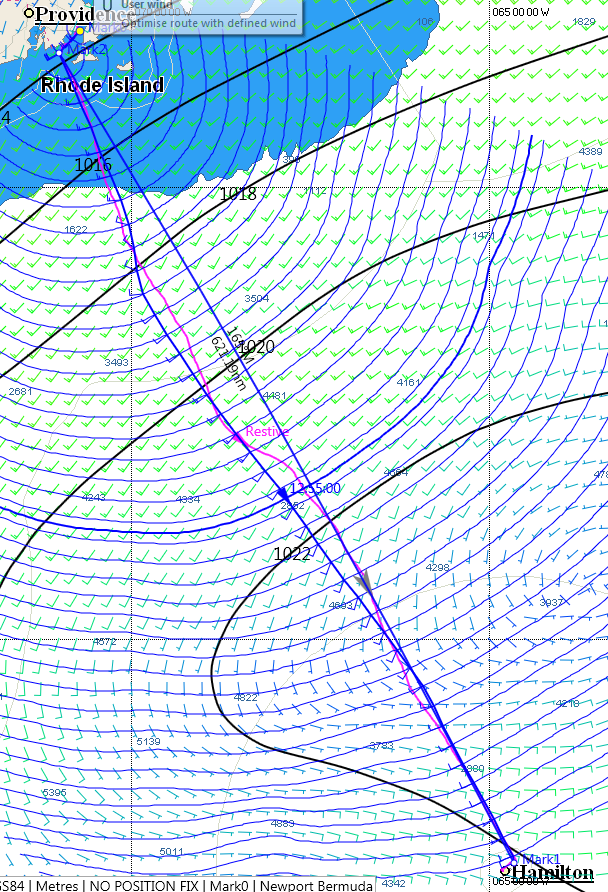 Name: RESTIVE
Elapsed: 94.2367 hours
Expedition Predicted: 83.7258 hours
Efficiency: 88.8%
ORR Predicted: 90.8915 hours
Class: B
ORR Rating: 0.893
 Name: SCAPPARE
Elapsed: 97.2875 hours
Expedition Predicted: 85.5497 hours
Efficiency: 87.9%
ORR Predicted: 97.9084 hours
Class: C
ORR Rating: 0.829
 Name: SCARLET
Elapsed: 92.885 hours
Expedition Predicted: 78.5025 hours
Efficiency: 84.5%
ORR Predicted: 84.813 hours
Class: A
ORR Rating: 0.957
 Name: SELKIE
Elapsed: 108.8622 hours
Expedition Predicted: 100.2233 hours
Efficiency: 92.1%
ORR Predicted: 110.28 hours
Class: D
ORR Rating: 0.736
 Name: SILHOUETTE
Elapsed: 95.6994 hours
Expedition Predicted: 87.1464 hours
Efficiency: 91.1%
ORR Predicted: 99.9582 hours
Class: D
ORR Rating: 0.812
 Name: SUNFLOWER
Elapsed: 91.3756 hours
Expedition Predicted: 77.2514 hours
Efficiency: 84.5%
ORR Predicted: 84.46 hours
Class: A
ORR Rating: 0.961
 Name: TABOR BOY
Elapsed: 97.5511 hours
Expedition Predicted: 82.2494 hours
Efficiency: 84.3%
ORR Predicted: 0 hours
Class: Classic
ORR Rating: 0
 Name: TIARA
Elapsed: 115.4358 hours
Expedition Predicted: 100.6583 hours
Efficiency: 87.2%
ORR Predicted: 110.43 hours
Class: D
ORR Rating: 0.735
 Name: YAQUINA
Elapsed: 94.1961 hours
Expedition Predicted: 85.4975 hours
Efficiency: 90.8%
ORR Predicted: 94.489 hours
Class: C
ORR Rating: 0.859
 Name: YUMI III
Elapsed: 113.1542 hours
Expedition Predicted: 84.4589 hours
Efficiency: 74.6%
ORR Predicted: 96.9726 hours
Class: C
ORR Rating: 0.837